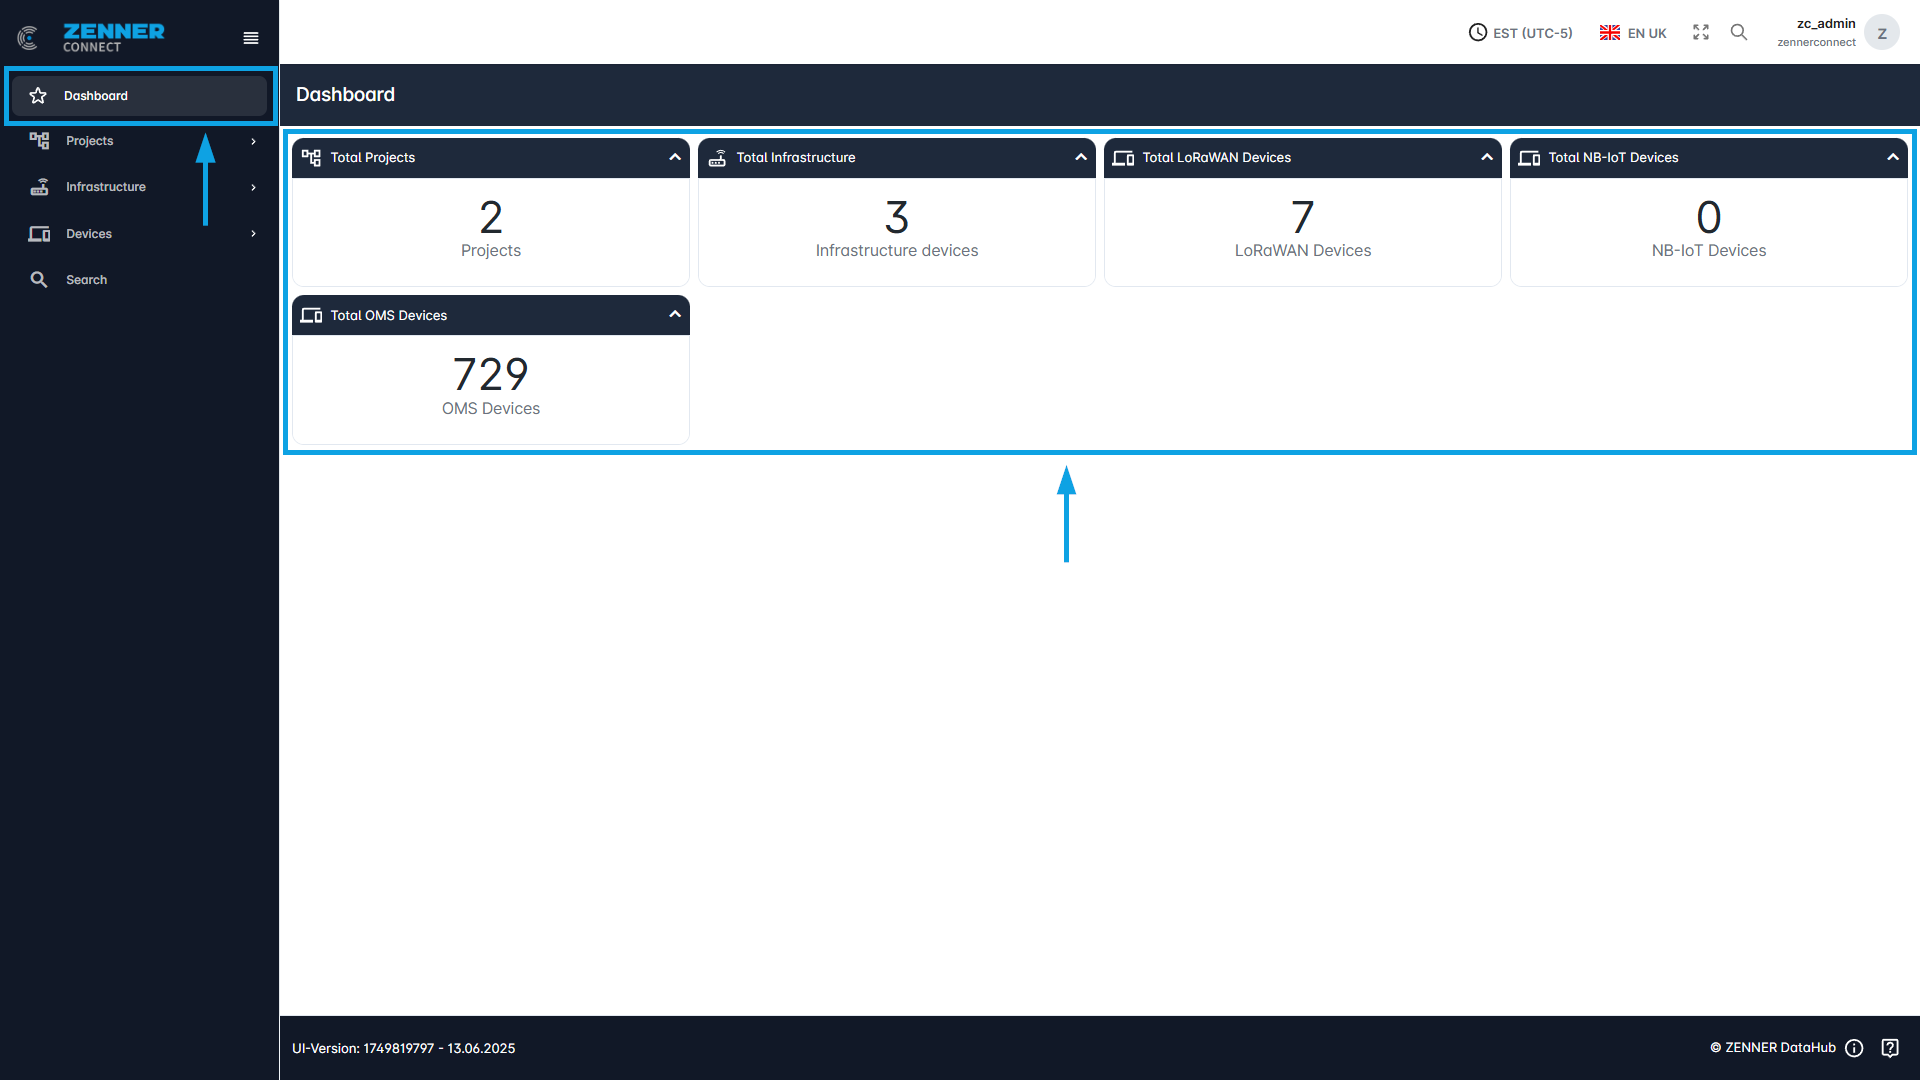
The dashboard is the first page that is called up after logging into the ZENNER Datahub. It gives you a general overview over your tenant with the following information:
- Total number of added Projects
- Total number of added Infrastructure Components
- Total number of added LoRaWAN Devices
- Total number of added NB-IoT Devices
- Total number of added Metering/OMS Devices
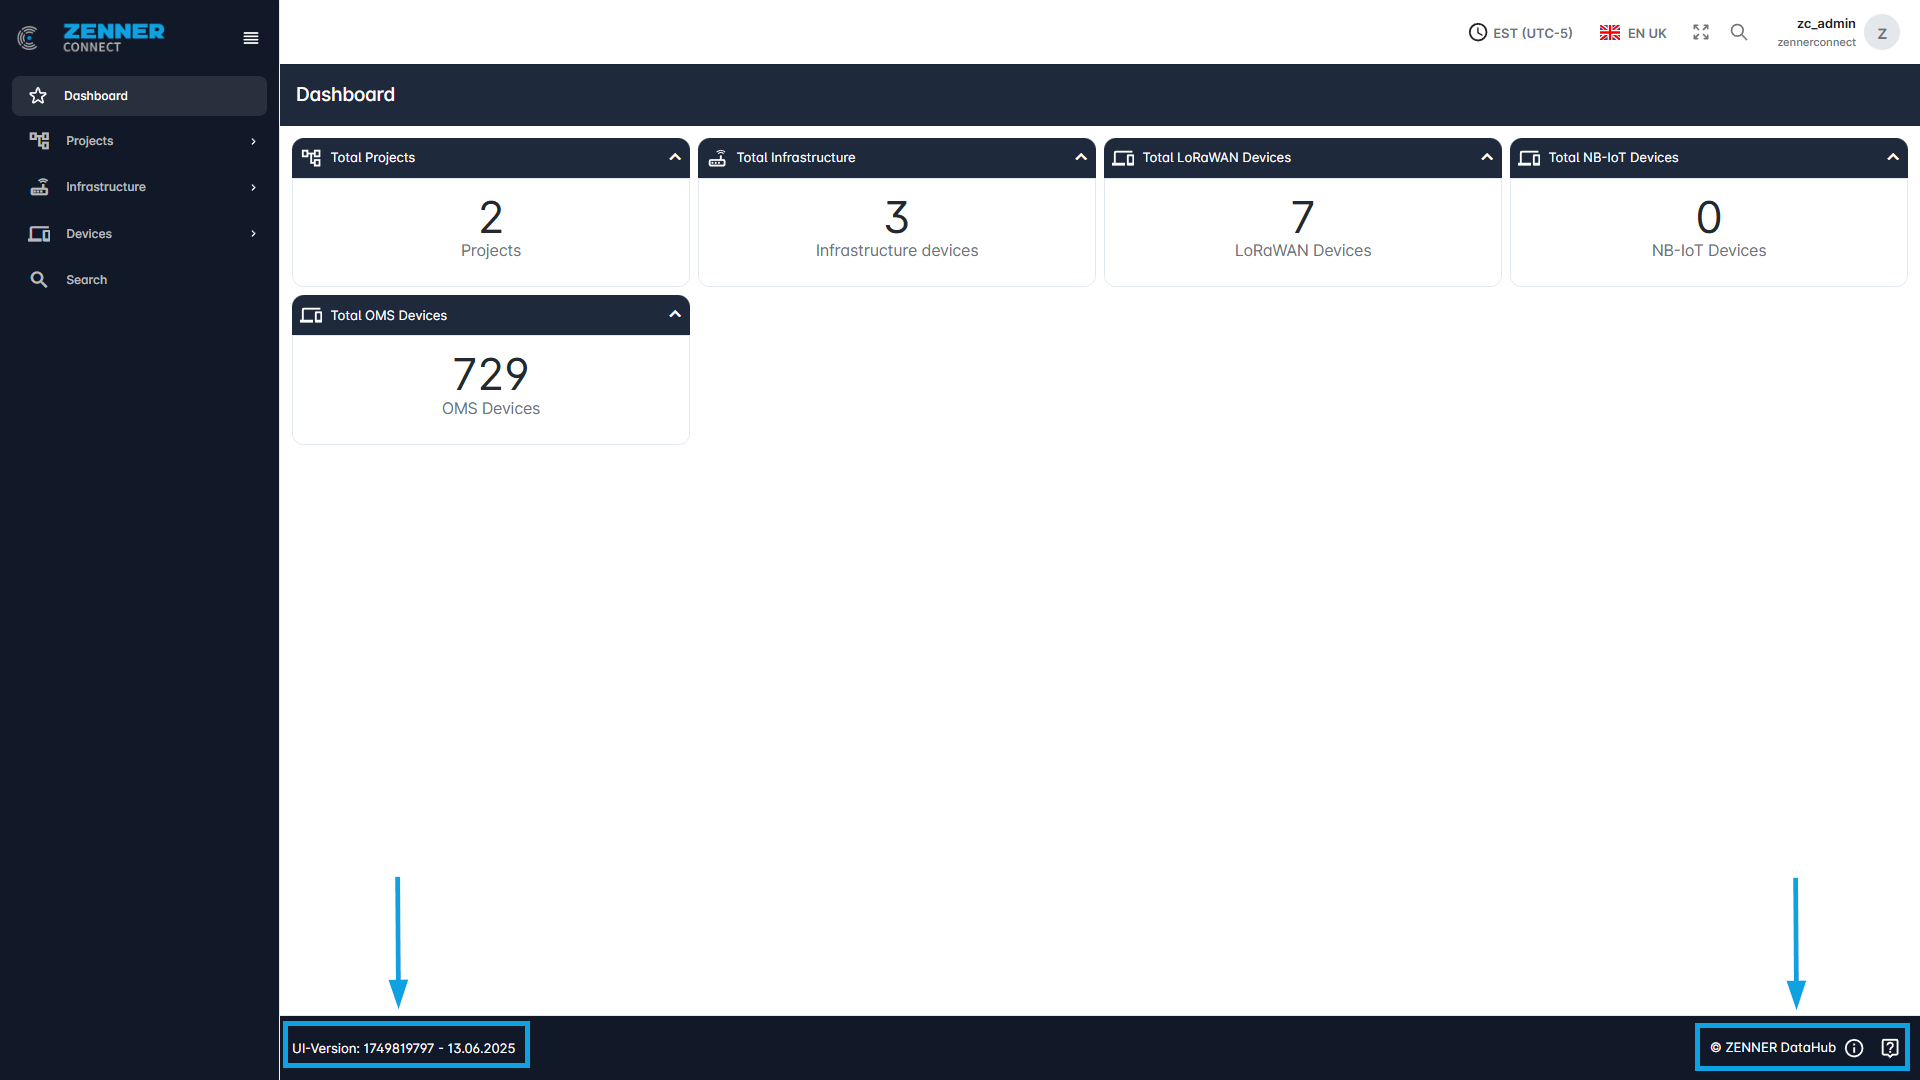
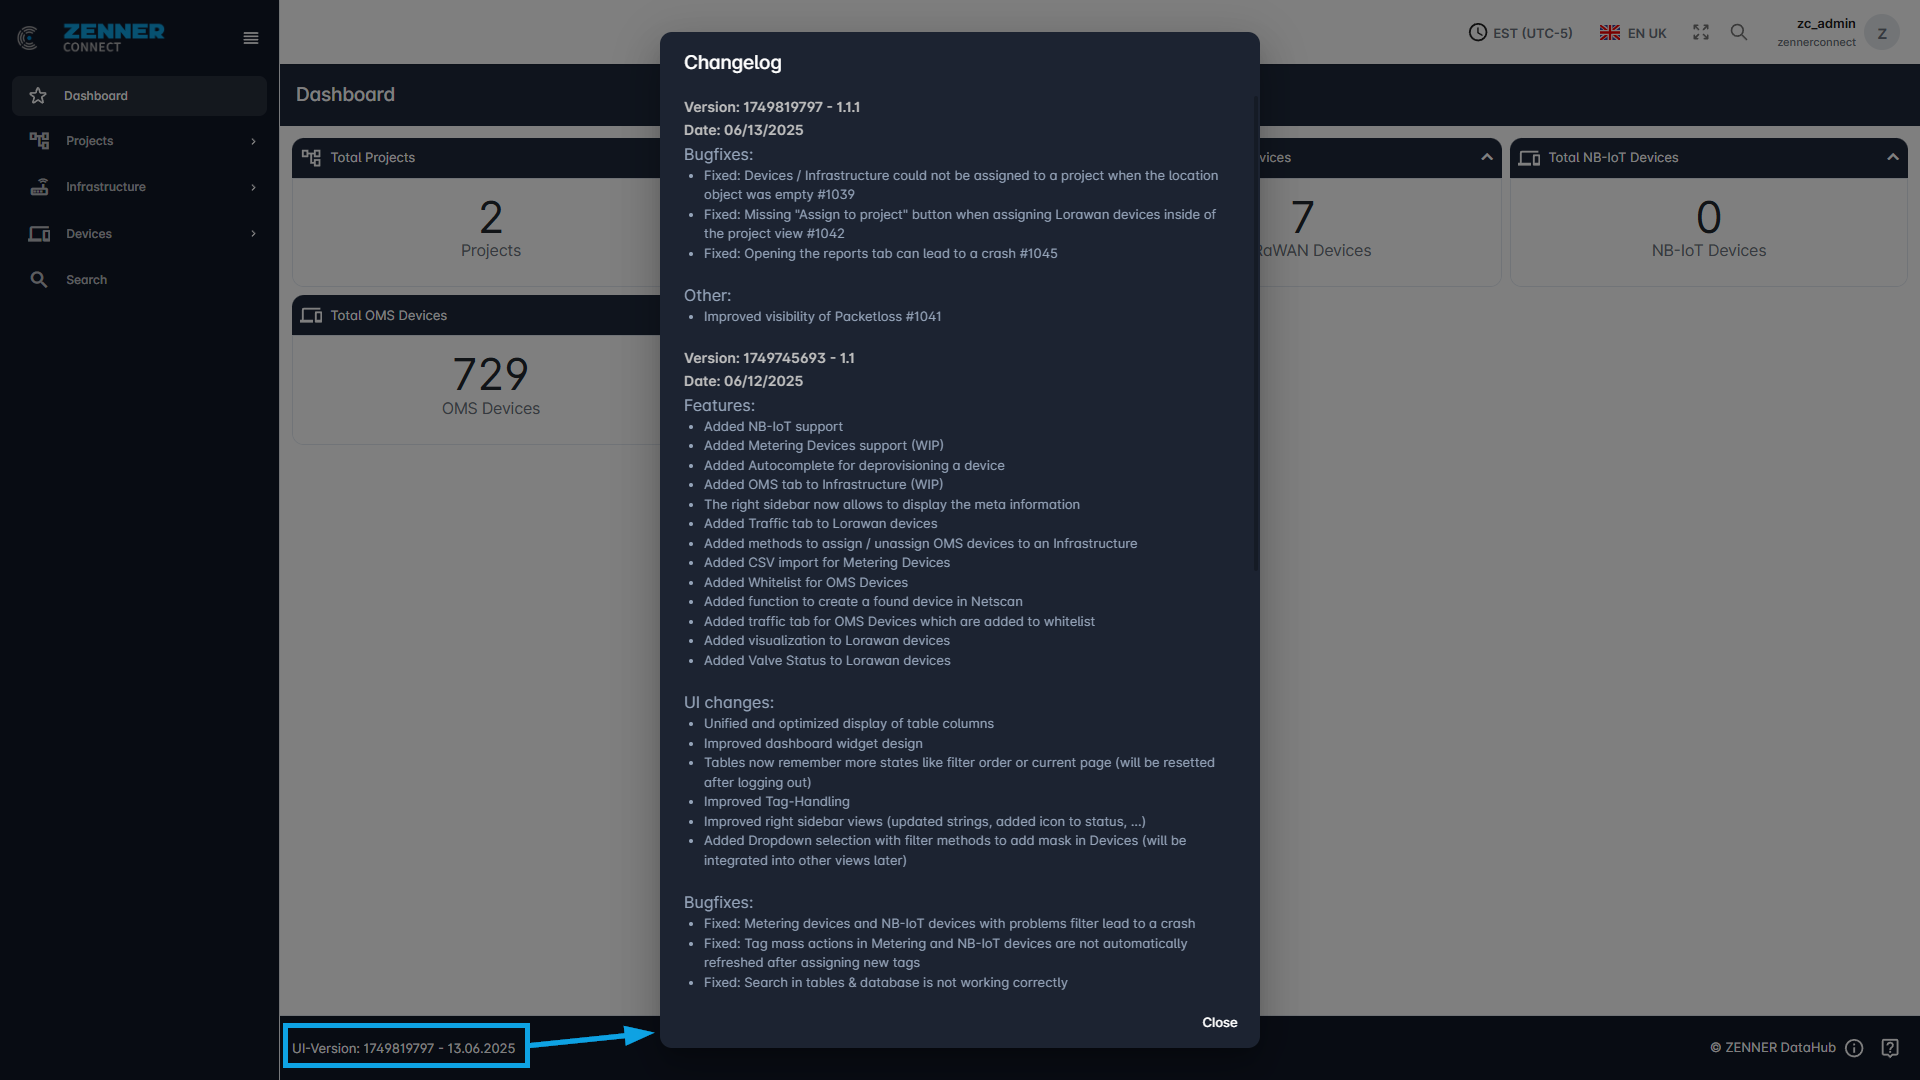
At the bottom, the current UI version is displayed on the left. Clicking on it displays the recent changelog. And on the right, you will find links to the ZENNER Datahub User Guide and the ZENNER Connect Service Desk, accessible via the exclamation mark and question mark symbols respectively.