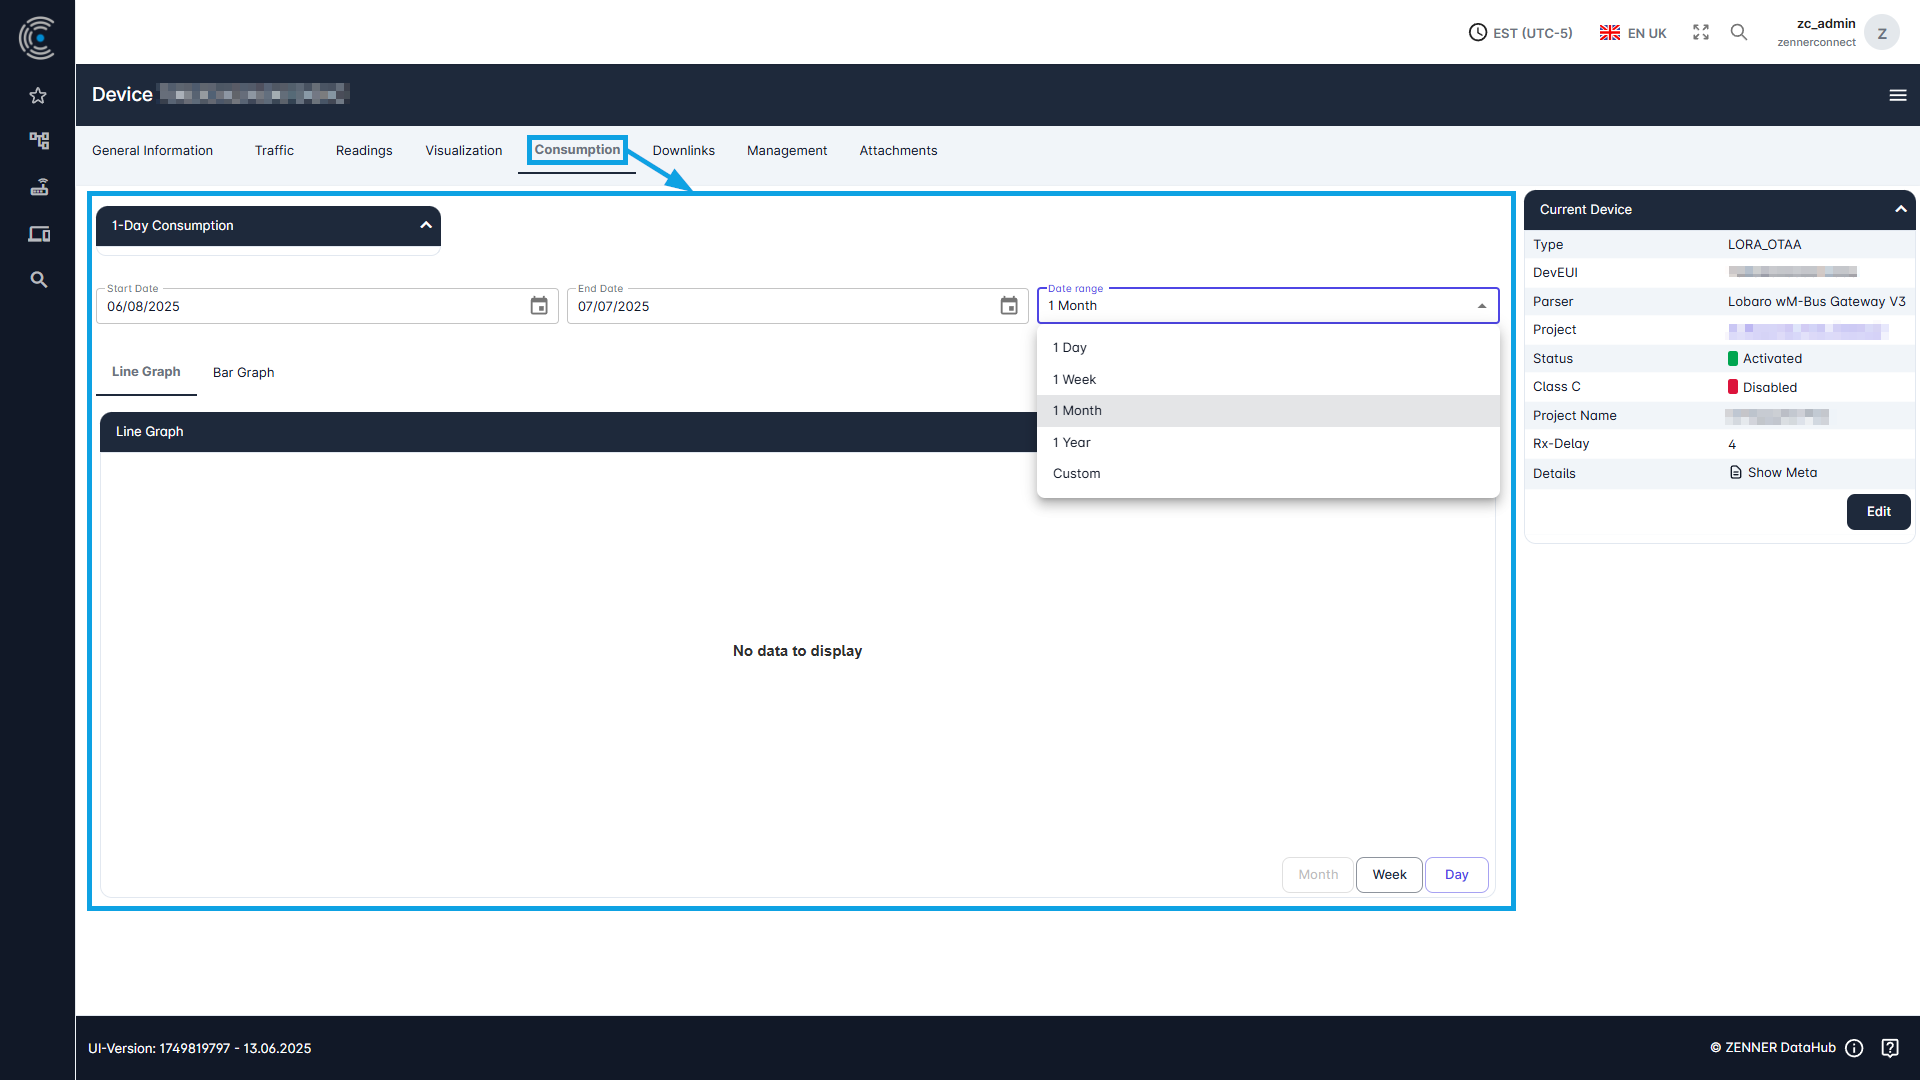
To view the consumption data of a metering device, go to the “Consumption” tab and select the time period for which the measured consumption should be displayed here. The consumption can be displayed in two different graphs (Line Graph or Bar Graph) here.
Tip: if you don’t see any consumption so far, it might help to broaden or change the selected time range, like in the example below.