
Traffic vs. Readings
Traffic = All raw data packets sent or received by a device, including encrypted measured values
Readings = Measured values sent/received by a device after decryption (parsing) of respective raw data packets
View Device Traffic
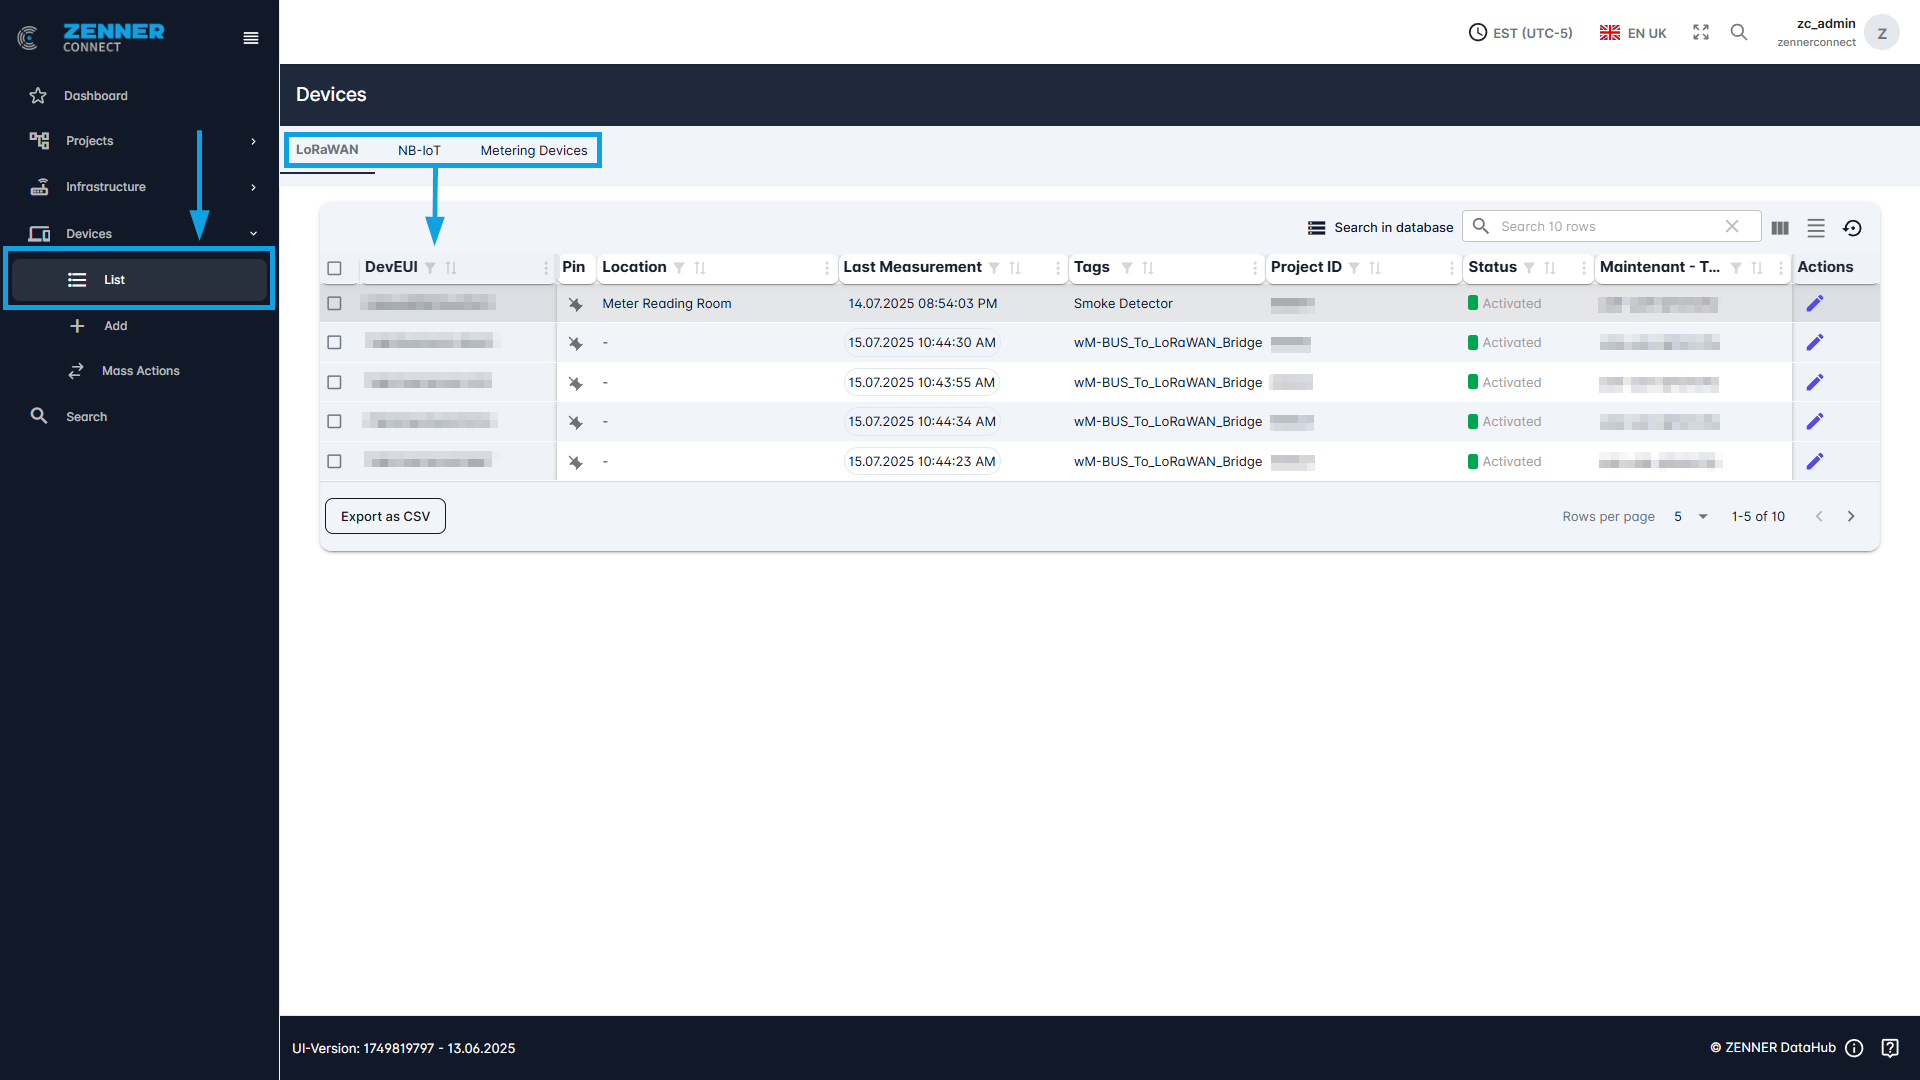
To display the raw traffic sent by a sensor, the sensor must first be selected. This is done under Devices -> List.
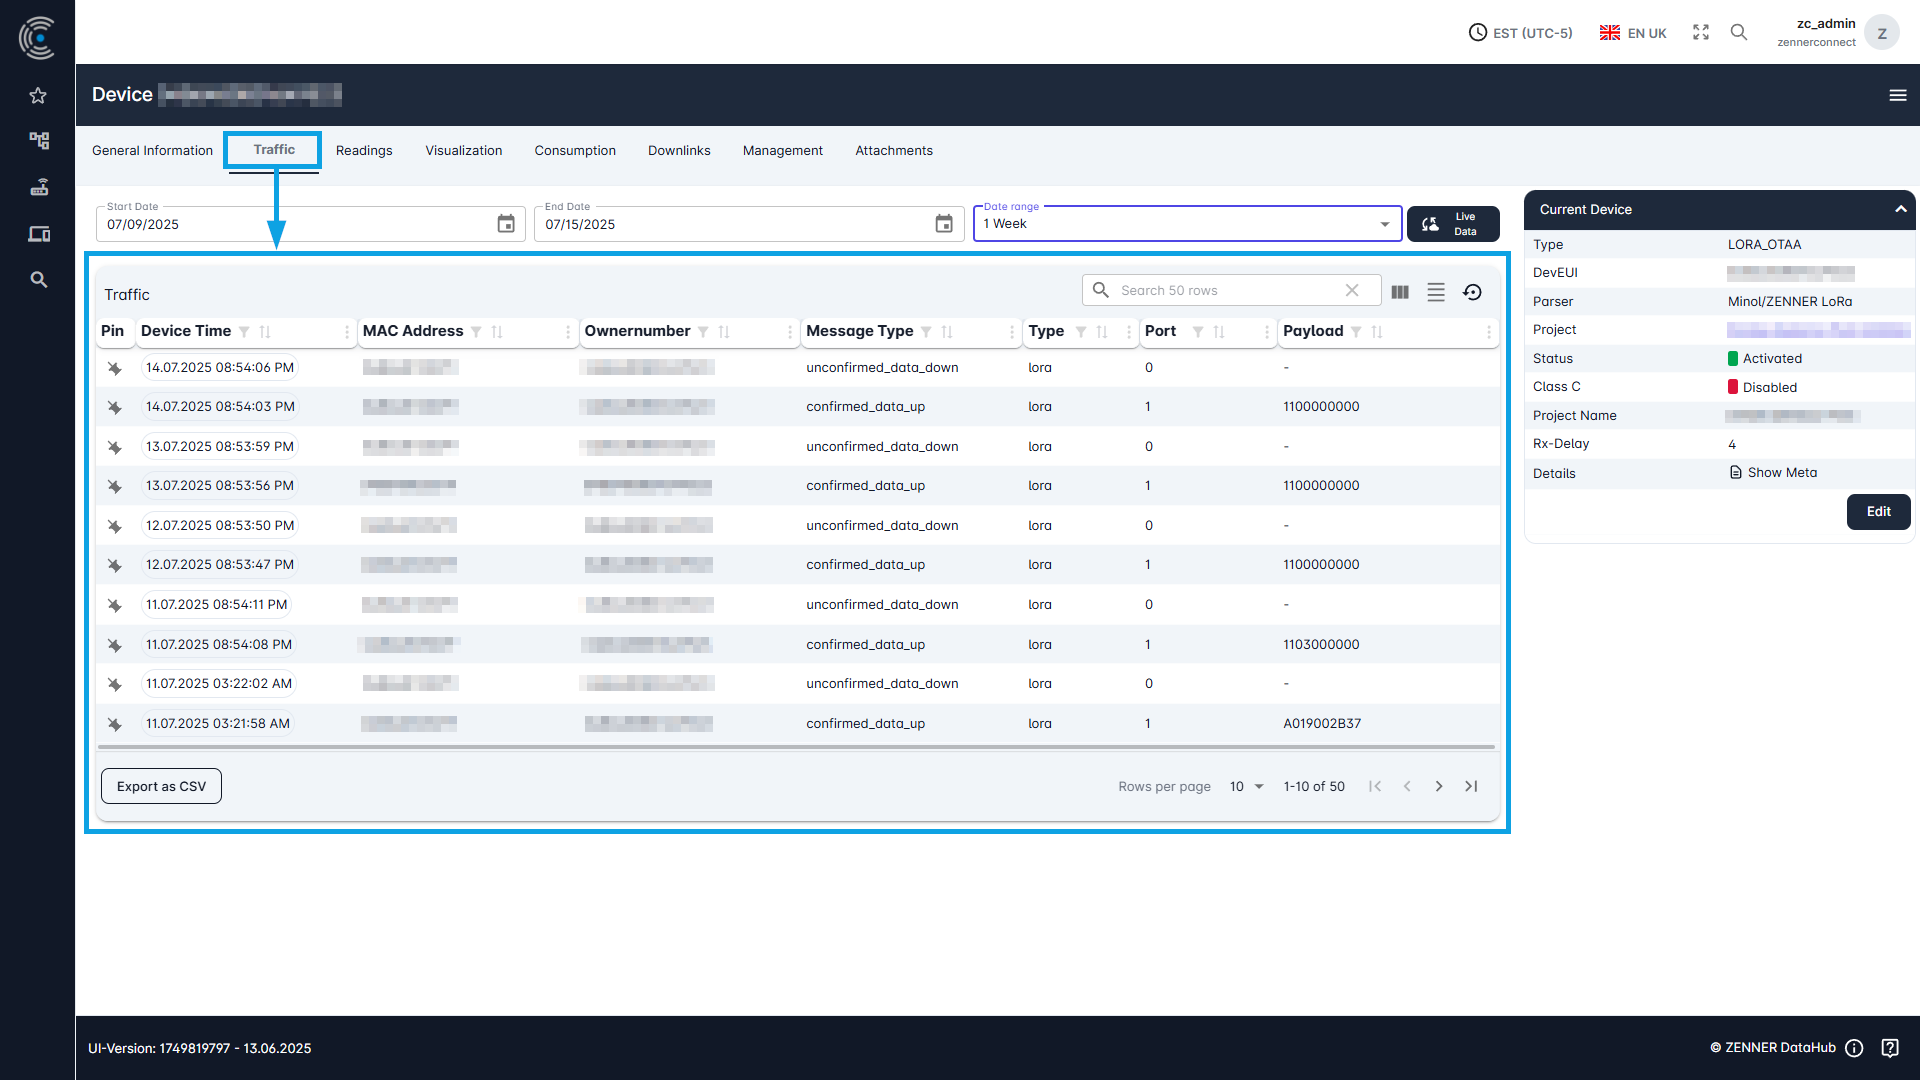
To display the device traffic, select the “Traffic” tab on the selected device.
Various data on the traffic received is displayed here in a list.
View Device Readings
To display the readings (= measured values) of a sensor, select the “Readings” tab on the selected device.
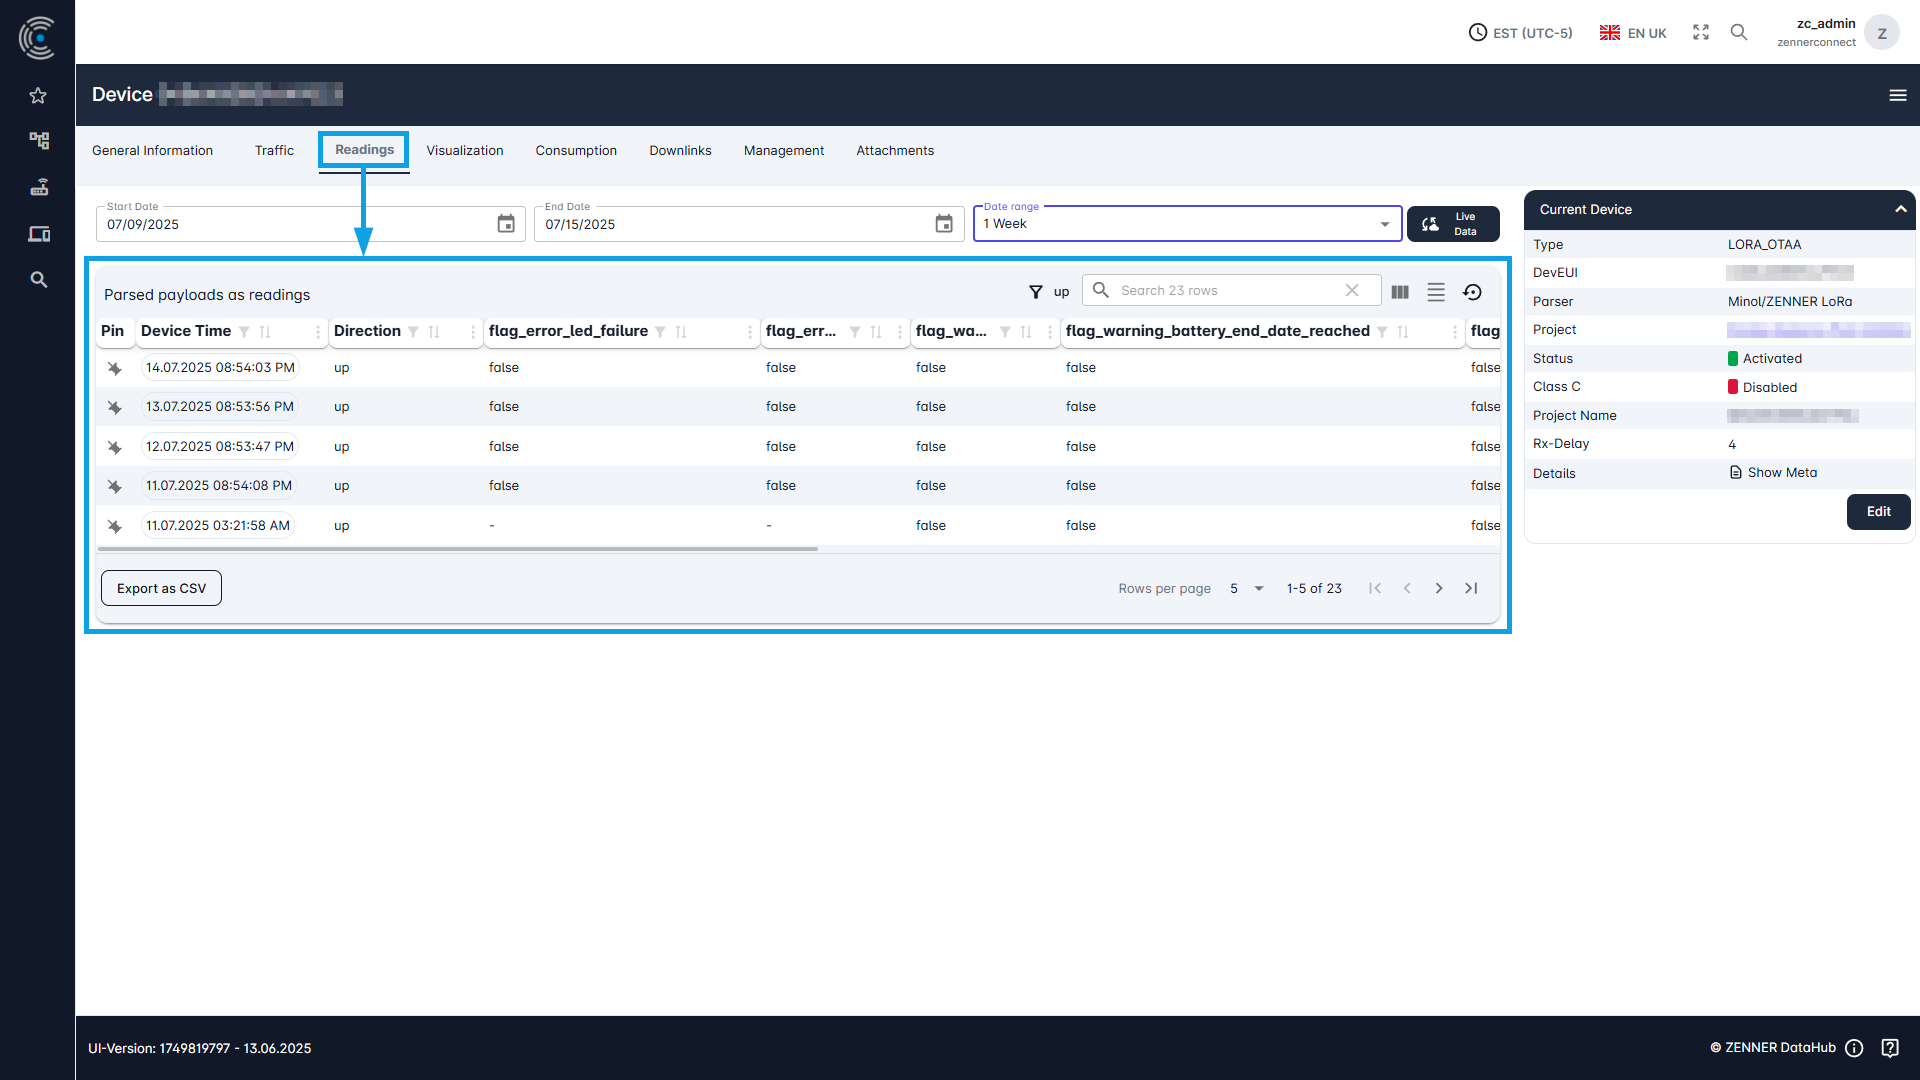
Here you have the option of filtering the readings according to a time period.
The “live data” button can also be used to activate the live update of the measured values.
If no measured values are displayed here, this may be due to the following:
- The chosen time period is too short
- The measured values are not received by any gateway
- The measured values are received but no parser is selected for the device
- The sensor is not activated
- The sensor was not stored correctly in the tenant (incorrect information)
Packet Message Types
In addition to the actual information, each data packet sent by the devices and received from the Datahub always contains information about the so-called “message type”, i.e., the type of packet in question.
Pakets with Readings
For packets with regular measurement values (readings), the message type always depends on the respective device type and is as follows:
- LoRaWAN devices → type “lora”
- NB-IoT devices → type “nbiot“
- Metering/OMS devices → type “omsraw”
Below an example of a JSON packet with readings for an NB-IoT device:
					{
  "_id": {
    "$oid": "69014ac97e49a2effda8842e"
  },
  "uid": "NBIOT-0e227a0d-71c7-41ef-959a-557e0d4d079215",
  "maintenant": "[main tenant name]",
  "data": {
    "nbiot": {
      "mtype": "unconfirmed_data_up",
      "port": 50045,
      "ip": "46.210.143.28",
      "host": "46.210.143.28",
      "dir": "up"
    },
    "ownernumber": "8ZRI9968995305",
    "raw": {
      "encrypted": "aAOJdxZgUDhlCAdJapkFU5loX6AAAwI2BQAAaQBAAwABAAChAAACJgD+k5o7AxkKHQABOAT8AgAABRkKHAU4GhADG2YBIBMAIzsAgAAABmsZCh0AAAABARgOlJo7EZSaOxSUmjsXlJo7GpSaOxyUmjsclJo7HJSaOxyUmjsclJo7HJSaOxyUmjsclJo7HJSaOxyUmjsclJo7HJSaOxyUmjsclJo7LZSaOy2UmjstlJo7LZSaOy2UmjsTAAQJAAgAAADb/tz+oQBIFg=="
    },
    "unmapped": {
      "volume": [
        999986204,
        19,
        "L",
        "Volume",
        999986.204,
        "m³"
      ],
      "0800010000FF": 999986204
    }
  },
  "clsbox": "DEADBEEF1020",
  "meta": {
    "packettype": "NB_FC02",
    "parser": "2.0.26",
    "sender": {
      "mtype": "unconfirmed_data_up",
      "port": 50045,
      "ip": "46.210.143.28",
      "host": "46.210.143.28",
      "dir": "up"
    },
    "generated": true,
    "SPValue": "NB_FC02",
    "billingperiod": "hourly",
    "devicetypename": "WZ",
    "devicetype": "IUWS_NB_IoT",
    "devicetypeid": 5
  },
  "type": "nbiot",
  "version": 1,
  "devicetypename": "IUWS_NB_IoT",
  "tenant": "[main or subtenant name]",
  "ts": {
    "server": 1761692360,
    "parser": 1761692360,
    "datastore": 1761692360,
    "eventtime": 1761739200,
    "device": 1761692360
  }
}
If needed, you can find a bit more information about the meaning of certain fields or sections in such a JSON packet with readings in the following table:
| Field/Section | Explanation/Meaning |
|---|---|
| "_id": { | internal use in database |
| "uid": | internal use in database |
| "maintenant": | current tenant - when using only main tenants, this is identical to the “tenant” field; when using main and subtenants, however, deviations are possible. |
| "nbiot": { | technical information about nbiot transmission |
| "ownernumber": | internal use for every type of deveui, serial number and the like |
| "encrypted": | encrypted raw payload |
| "unmapped": { | decrypted and parsed payload with measured values (readings) |
| "clsbox": | internal use for any type of gateway - BUT is not needed in nbiot, will not be part of nbiot output in the future and also contains only a placeholder |
| "meta": { | technical information about the transmission |
| "generated": | internal use |
| "SPValue": | internal use |
| "billingperiod": | billing period scenario in which the device is |
| "devicetypename": | abbreviation used for device types (heat meter, water meter, etc.) |
| "devicetype": | specific device type = device model + technology (LoRaWAN, NB-IoT, Metering/OMS) |
| "devicetypeid": | id for the above device type |
| "type": | general type of this message - here "nbiot", but could be also e.g. "event", "lora" or "omsraw" (you can e.g. categorise your received transmissions by this) |
| "version": | internal use |
| "devicetypename": | see above |
| "tenant": | see above |
| "ts": { | various unix timestamps |
| "server": | unix timestamp when this message reached the server |
| "parser": | unix timestamp when this message reached the parser |
| "datastore": | unix timestamp when this message reached the datastore |
| "eventtime": | unix timestamp when this device did its readout |
| "device": | unix timestamp for internal time of the device (missmatch can be seen here if there is one) |
Packets with Smart Alerts
In addition to the regular readings, certain devices can also generate so-called “Smart Alerts”. These devices can monitor themselves and issue possible problems in the form of these Smart Alerts, e.g., low battery level or other important status changes/events. Other than the packets with the regular readings, all packets containing such Smart Alerts are from the message type “event”.
Below an example of a JSON packet containing a Smart Alert event for an NB-IoT device:
					{
  "_id": {
    "$oid": "69014ac9cb4f4b025da87dc8"
  },
  "uid": "EB-5a37c7b3-259d-4bde-9ce1-43f443af8259",
  "maintenant": "[main tenant name]",
  "data": {
    "ownernumber": "8ZRI9968995305",
    "source": {
      "uid": "NBIOT-0e227a0d-71c7-41ef-959a-557e0d4d0792",
      "causedBy": "parser",
      "type": "nbiot"
    },
    "event": {
      "mtype": "unconfirmed_data_up",
      "text": "cleared",
      "classification": "warning_battery_ndc_low"
    }
  },
  "type": "event",
  "version": 1,
  "tenant": "[main or subtenant name]",
  "ts": {
    "event": 1761692360,
    "device": 1761692360
  }
}
If needed, you can find a bit more information about the meaning of certain fields or sections in such a JSON packet with Smart Alerts in the following table:
| Field/Section | Explanation/Meaning |
|---|---|
| "_id": { | internal use in database |
| "uid": | internal use in database |
| "maintenant": | current tenant - when using only main tenants, this is identical to the “tenant” field; when using main and subtenants, however, deviations are possible. |
| "ownernumber": | internal use for every type of deveui, serial number and the like |
| "source": { | reason for this event to happen |
| "uid": | internal use in database |
| "causedBy": | what caused this message (e.g. the parser) |
| "type": | technology used for transmission |
| "mtype": | direction of the message - e.g. "unconfirmed_data_up" = Uplink from the device to the datahub |
| "text": | additional information if given by the event from the parser |
| "classification": | type of reason that this alarm was triggered - e.g. low battery |
| "type": | general type of this message - here "nbiot", but could be also e.g. "event", "lora" or "omsraw" (you can e.g. categorise your received transmissions by this) |
| "version": | internal use |
| "tenant": | see above |
| "ts": { | various unix timestamps |
| "event": | unix timestamp when this event was triggered - like "eventtime" in readings |
| "device": | unix timestamp for internal time of the device (missmatch can be seen here if there is one) |