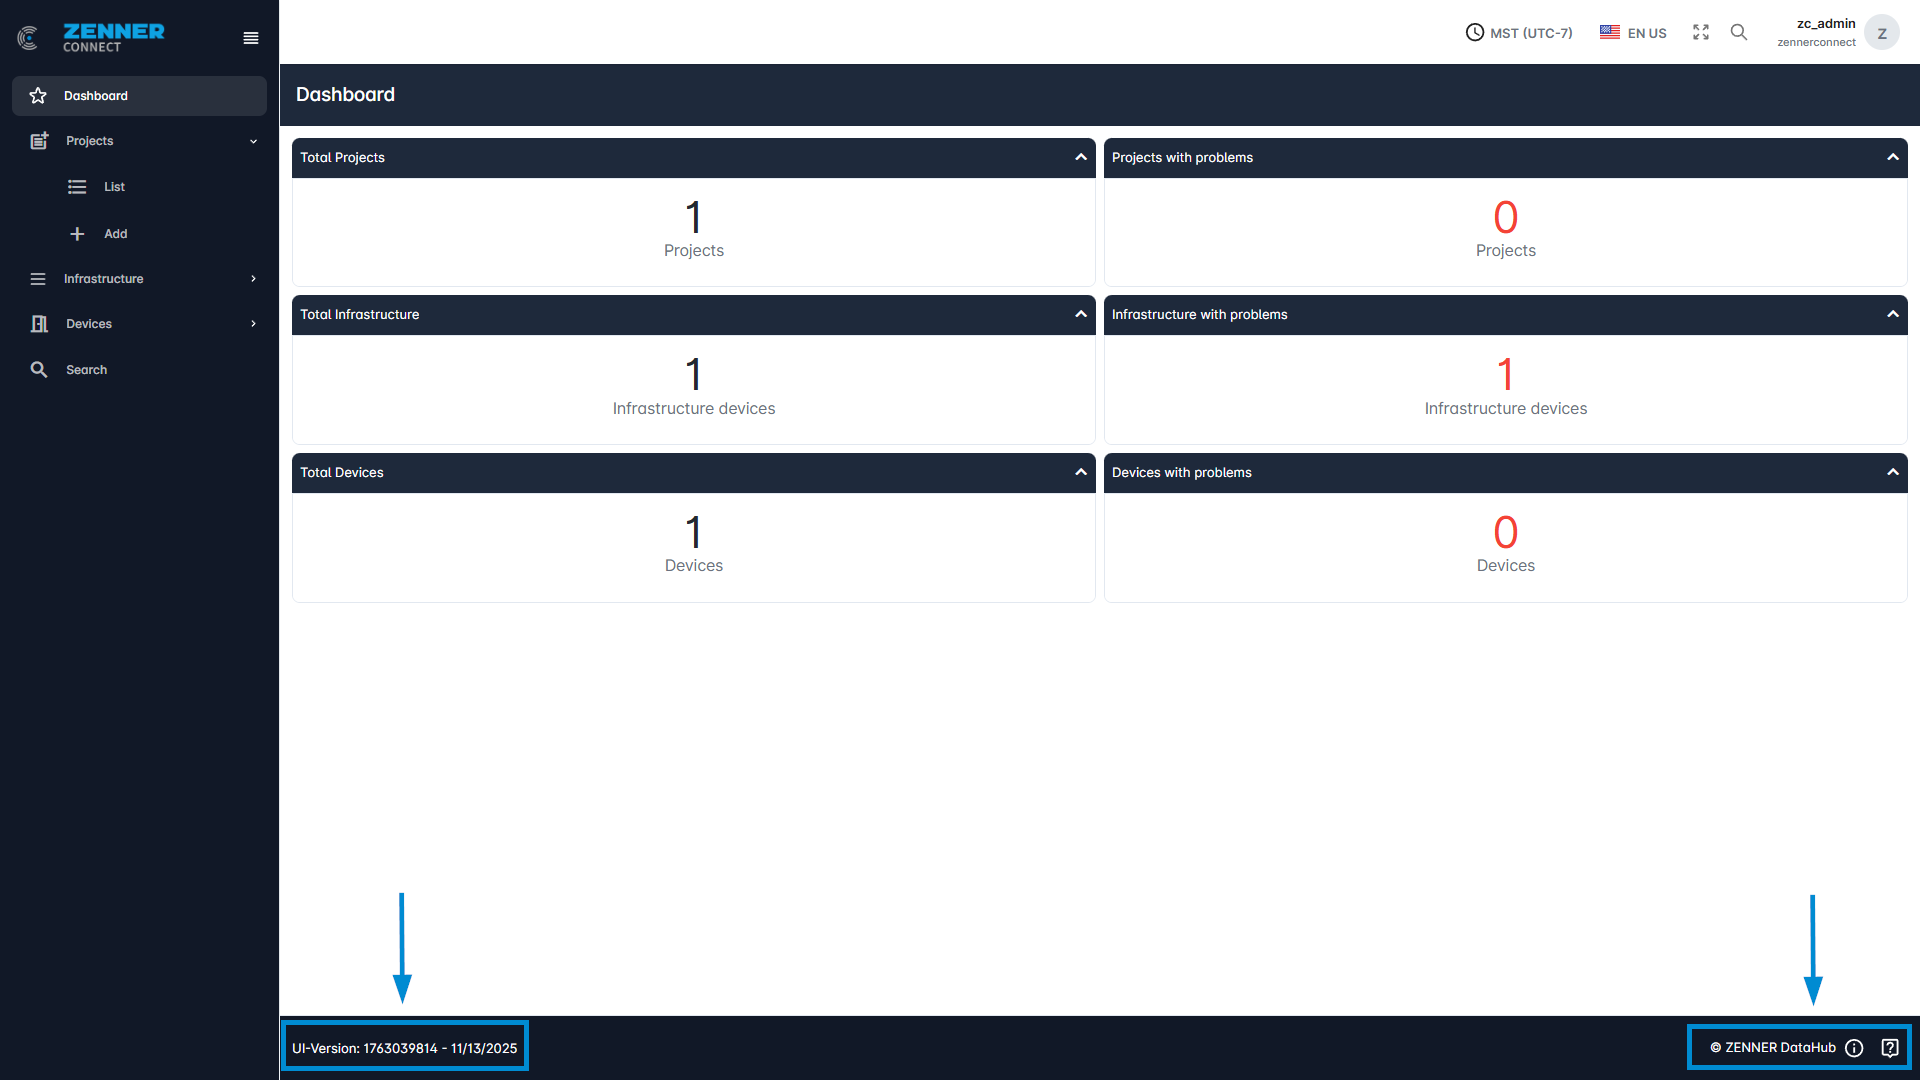
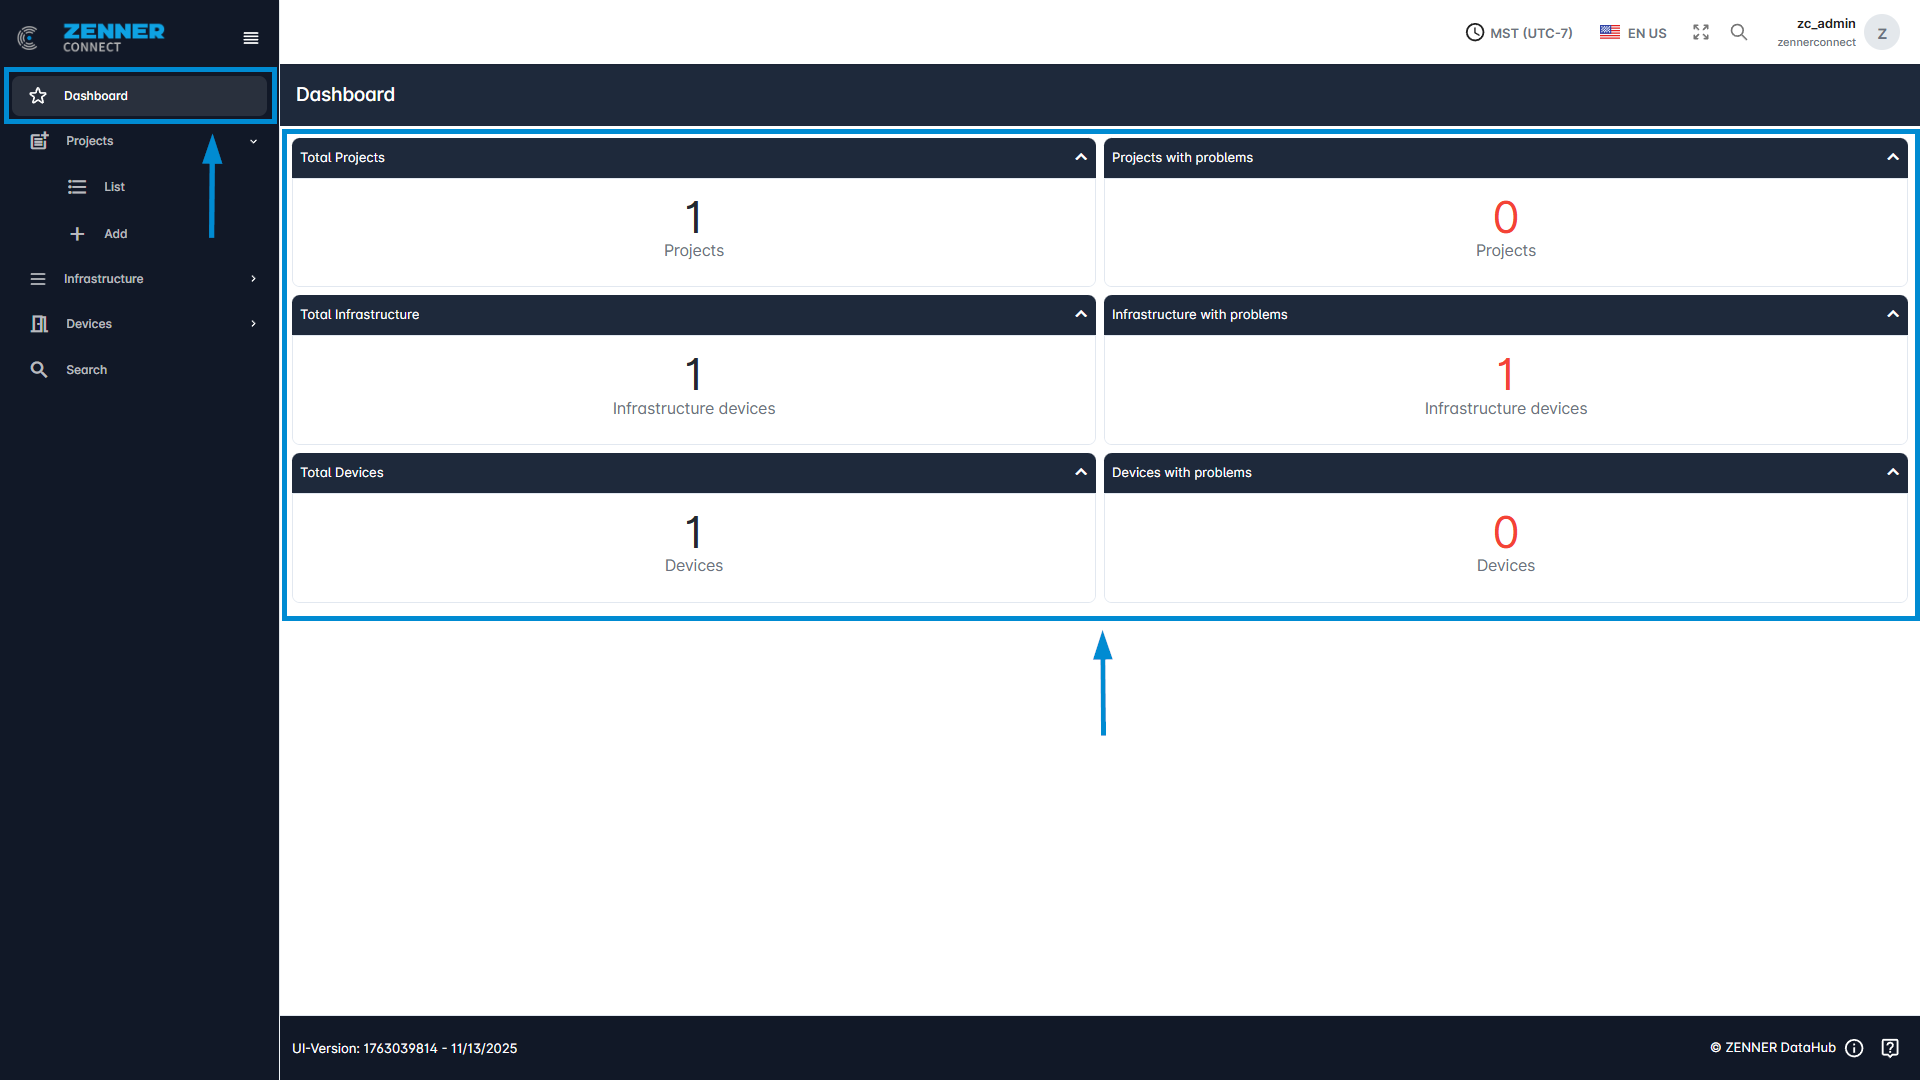
The dashboard is the first page that is called up after logging into the ZENNER Datahub. It gives you a general overview over your tenant with the following information:
- Total number of Projects + Projects with problems
- Total number Infrastructure Devices + Infrastructure Devices with problems
- Total number of Devices + Devices with problems
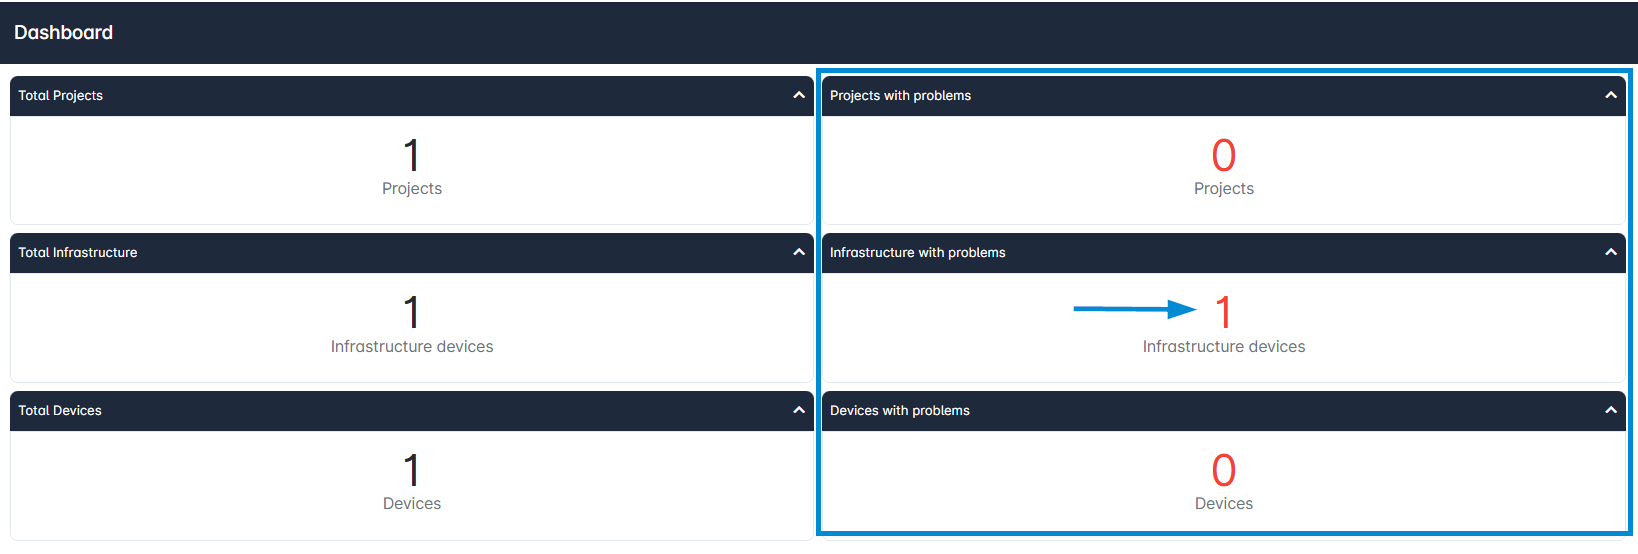
If there are any projects, infrastructure devices, or devices with problems, you can simply click on the respective number to see the list and take a closer look. In the following example, you would land on the Infrastructure List with the corresponding filter “Infrastructure with problems”, activated.
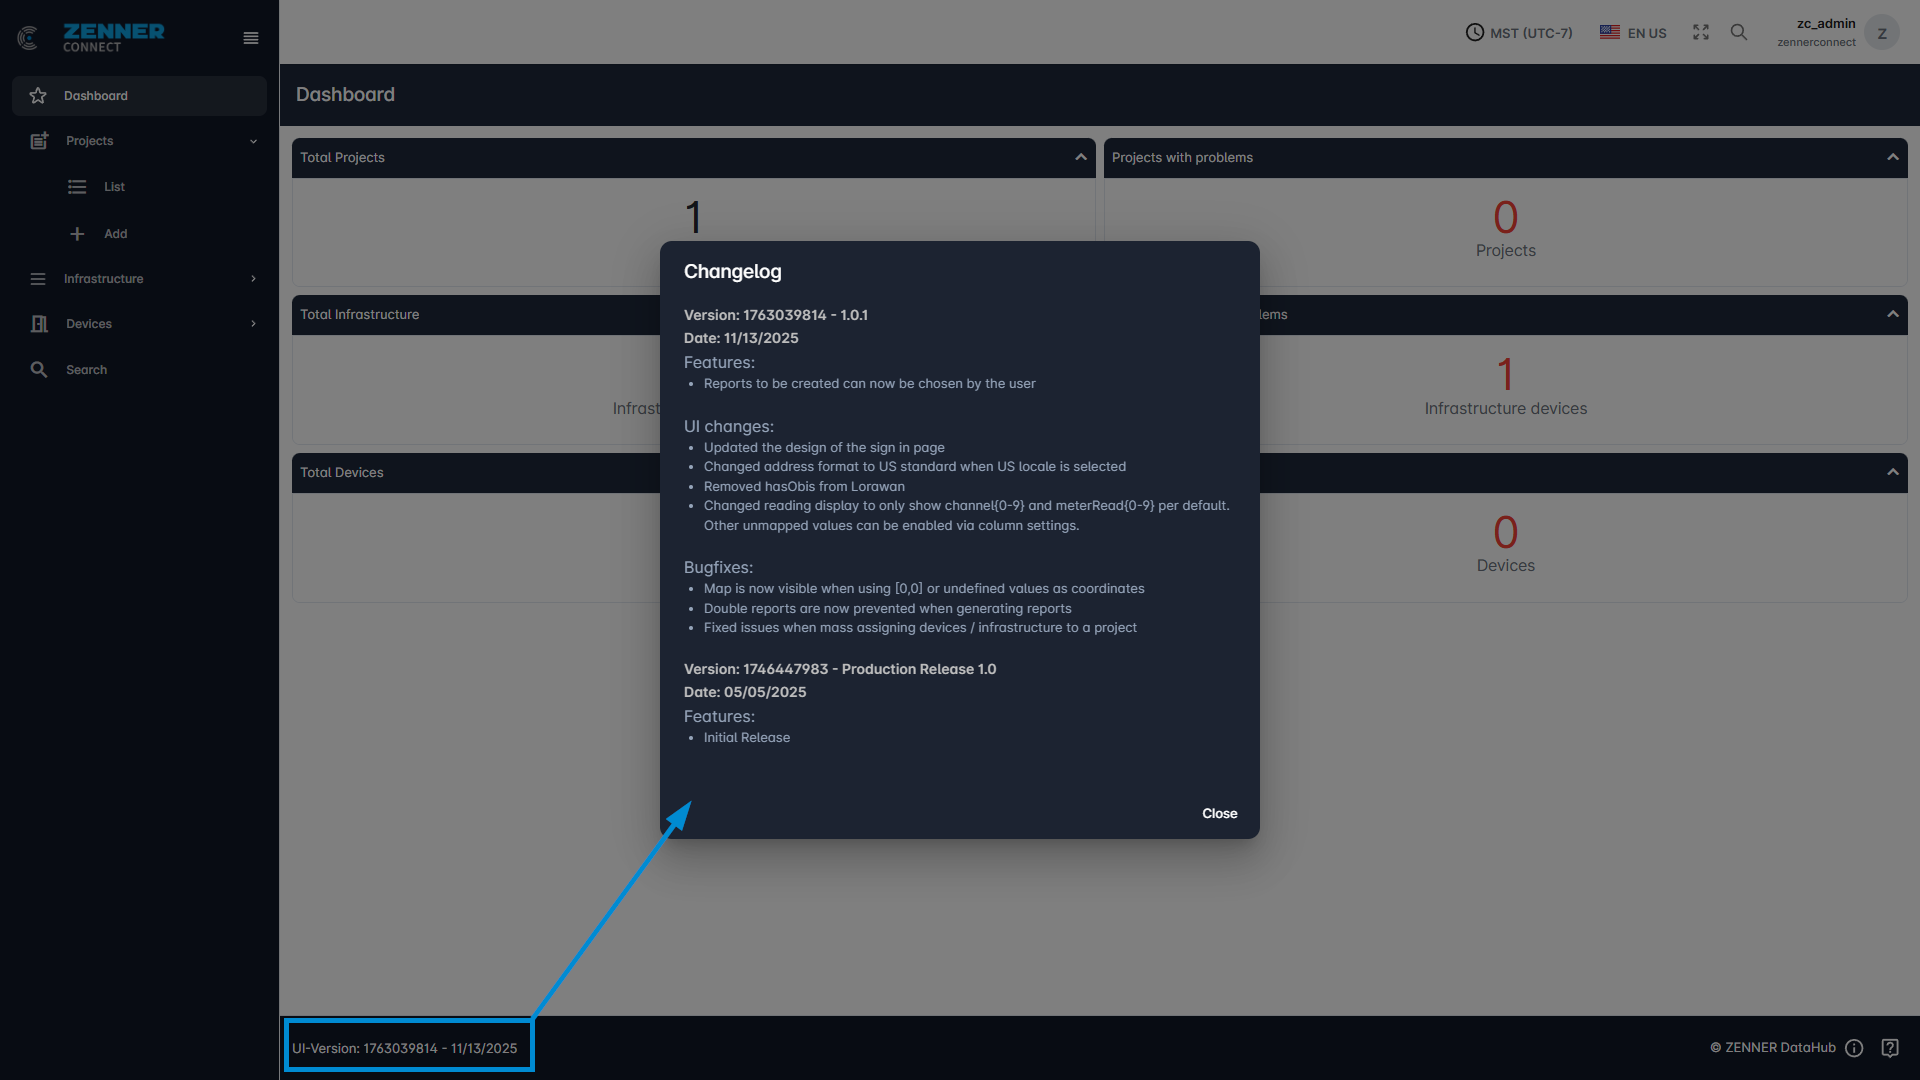
Furthermore, at the bottom, the current UI version is displayed on the left. Clicking on it displays the recent changelog. And on the right, you will find links to the ZENNER Datahub User Guide and the ZENNER Connect Service Desk, accessible via the exclamation mark and question mark symbols respectively.