
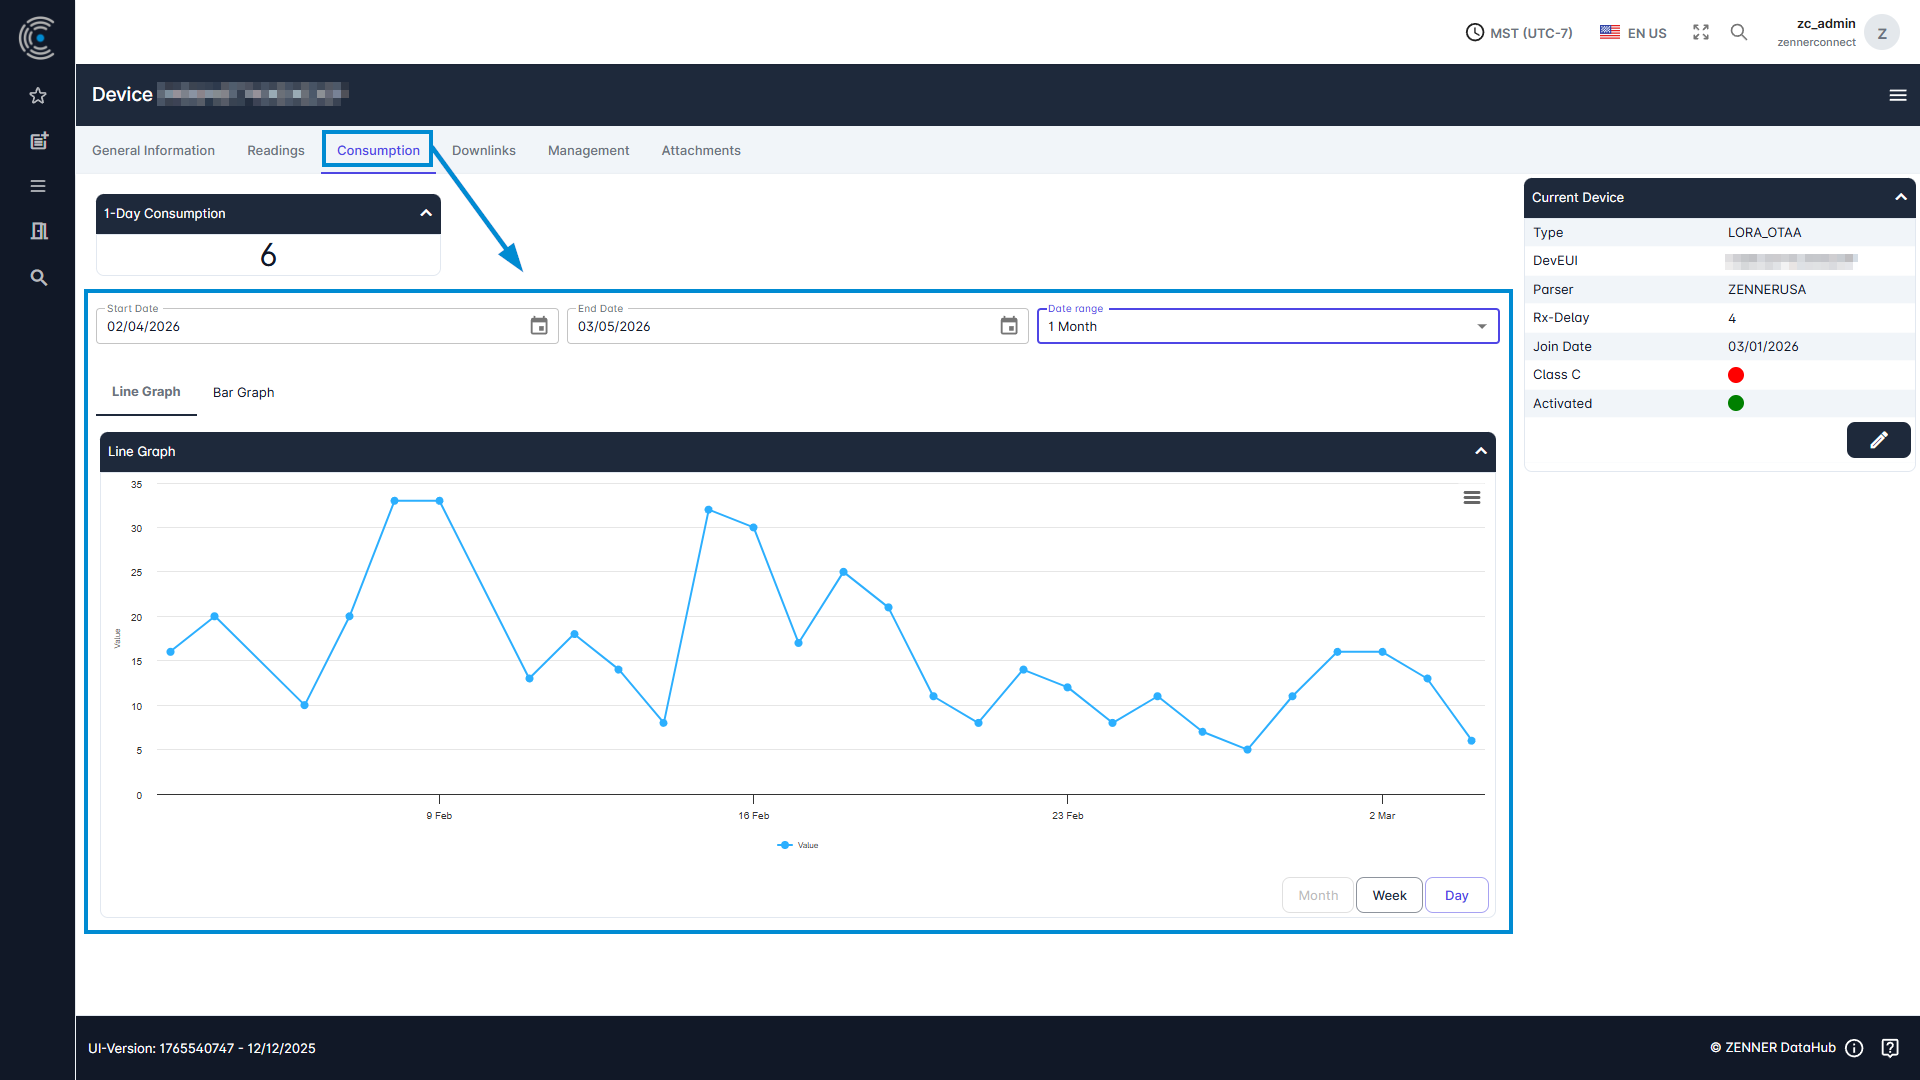
The consumption for a device/meter can be viewed in the same way as the readings themselves, with the difference that in this case you select the “Consumption” tab. The consumption can be displayed in two different graphs here: a line graph or a bar graph.
Tip: if you don’t see any consumption so far, it might help to broaden or change the selected time range, like in the example below.
If no measured values are displayed here, this may be due to the following:
- The chosen time period is too short
- The measured values are not received by any gateway
- The measured values are received but no parser is selected for the device
- The meter/sensor is not activated
- The meter/sensor was not stored correctly in the tenant (incorrect information)